DevOps monitoring increases the value of your software – find out more about Sentry
In modern software development, speed and reliability are not just competitive advantages – they are essential requirements. In a continuous integration and continuous deployment (CI/CD) environment based on the DevOps methodology, it is critical that every code update and release runs smoothly and without errors. DevOps monitoring plays a key role in this environment, as it not only provides a real-time view of software operation and performance, but also opens the door to new opportunities for increasing the value of the software. Monitoring enables the rapid identification and resolution of issues, the optimal use of resources and the continuous improvement of the user experience, all of which lead to significant competitive advantages and increased customer satisfaction.
In this blog post, we’ll be introducing Sentry, a secret weapon for maximizing the value of your software. Sentry offers comprehensive tools for error reporting, performance monitoring and tracing user issues, enabling continuous software improvement and minimizing downtime. When your software runs flawlessly, its market value and appeal to customers increase. Find out how you can use Sentry to streamline your DevOps operations and thereby increase the value of your software!
- DevOps monitoring
- What problems does DevOps monitoring solve?
- Monitoring and Fault Tracking Service – Sentry
- Continuously improve your services using data-driven DevOps and Sentry
- Proactive monitoring helps to rectify errors before they affect business operations
- It’s easy to set up a DevOps monitoring tool
- Tools such as Sentry make it possible to collect error data without compromising privacy
- Let’s work together to increase the value of your software
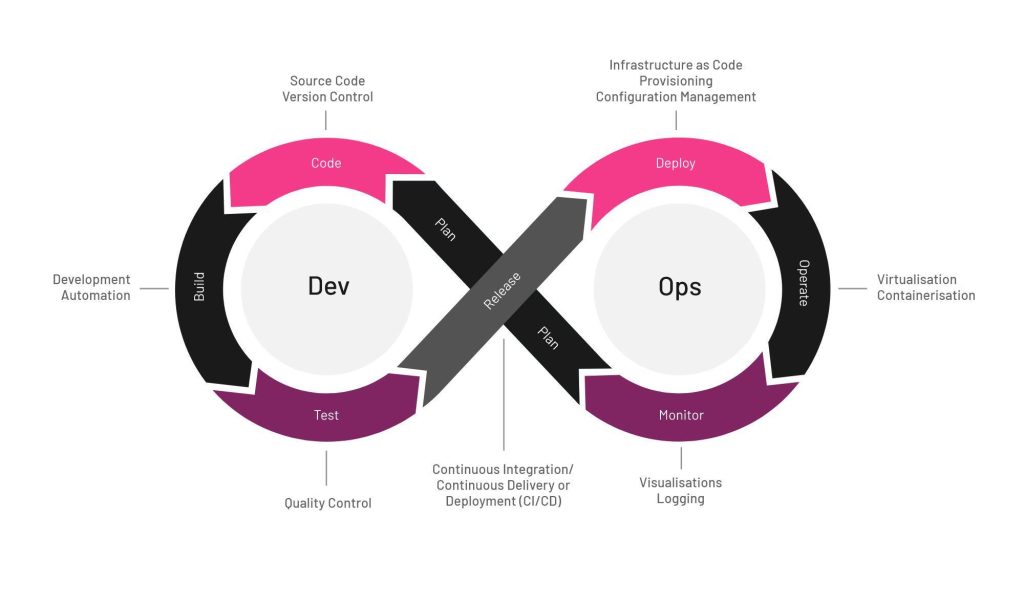
DevOps monitoring
DevOps monitoring refers to the monitoring and measurement of the performance and health of systems and applications throughout the entire software lifecycle. It is a critical part of the DevOps methodology, which aims to improve the speed and reliability of software delivery. The DevOps methodology emphasizes rapid iterations, continuous feedback and process improvement, and monitoring plays a central role in this. It helps to identify bottlenecks, performance issues and other risks that could slow down production or reduce the quality of software products. Through active monitoring, organizations can respond quickly to problems and make the necessary changes before they affect the user experience or business results.
Furthermore, DevOps monitoring promotes transparency and collaboration between development, testing and operations teams. Sharing information in real time enables different stakeholders to gain a better understanding of the status of systems and promotes a shared view of the project’s progress. This collaboration and openness play a key role in improving the speed and reliability of software deliveries and reducing errors that arise during development.
In practice, DevOps monitoring integrates a range of technologies and tools, such as log management systems, performance monitoring tools and automated alerting systems, all of which help to monitor and assess the status of infrastructure and applications. These tools enable teams to manage and scale systems more effectively to meet business requirements. DevOps monitoring is not merely a technical requirement, but a strategic resource that enables more flexible, responsive and sustainable software development practices.
The key areas of DevOps monitoring include:
- Collecting data from various metrics, such as CPU usage, disk space, application response times and others.
- Real-time visibility and a single view of the performance of applications and infrastructure.
- Proactively identifying and resolving problems before they affect production.
- Optimizing the DevOps toolchain by identifying opportunities for automation.
- Monitoring of key DevOps metrics, such as release frequency, defect rate, mean time to detect (MTTD), mean time to mitigate (MTTM) and mean time to repair (MTTR).
DevOps monitoring utilizes tools designed for infrastructure monitoring, application performance monitoring and network monitoring to provide comprehensive visibility throughout the entire software delivery pipeline. The data collected by DevOps monitoring enables data-driven decision-making, proactive fault tracking and continuous improvement of the software delivery process. It is therefore a crucial practice that empowers DevOps teams to maintain the health and performance of their systems and applications, thereby supporting the goals of faster and more reliable software delivery.
What problems does DevOps monitoring solve?
One of the biggest challenges facing DevOps teams is maintaining high-quality, functional software in a constantly changing and demanding development environment. Without an effective monitoring system, teams may encounter numerous issues that compromise the application’s performance and security. For example, performance issues, such as slow loading times or functional delays, can be caused by a variety of factors, including inefficient code or insufficient server resources. These issues not only reduce the quality of the user experience (UX) and cause user frustration, but can also directly undermine the software’s market value, as customers may turn to competitors’ better-performing products.
Furthermore, security risks are a major cause for concern. Without continuous monitoring and analysis, vulnerabilities may go undetected, leaving the software exposed to potential attacks. This not only threatens user data, but can also damage a company’s reputation and result in financial losses. Reputational damage and potential data breaches can hinder the software’s growth in value and even lead to a loss of customers.
Troubleshooting is also challenging without proper monitoring. Identifying problems, determining their root causes and rectifying them can be extremely time-consuming, which delays the development and release of new features. This slows down the development team’s work and increases the wait time for customers before the problems are resolved. When development and fixes are delayed, the software’s value cannot be maximized, which prevents the company from gaining a competitive advantage and increasing its revenue streams.
These challenges can jeopardize the success of a software project and prevent a company from realizing its full potential. However, DevOps monitoring enables these issues to be identified and resolved effectively, thereby improving both the quality of the application and the team’s performance, and thus helping to increase the software’s value in the market.
Nor should we forget the opportunity to influence the environmental impact of technology. ‘Green code’ refers to programming practices that minimize energy and resource consumption, making applications more energy-efficient and therefore more environmentally friendly. Tools such as Sentry can help with this by providing data on an application’s efficiency, which can guide developers in writing more efficient and greener code. Monitoring can also promote more responsible and environmentally friendly software development, which is increasingly important for modern businesses seeking to reduce their carbon footprint and promote sustainable development.
Monitoring and Fault Tracking Service – Sentry
Sentry is an open-source error monitoring and tracing service that helps developers detect, track and fix problems occurring in applications in real time. With Sentry, developers can more effectively manage application performance and stability across a range of programming platforms and environments, including Python, JavaScript, Java, PHP, Ruby, C#, iOS, Android and many others.
At Hurja, we can set up Sentry to monitor your app if you wish, and we’ll tailor the monitoring service to meet your exact needs. Find out more!
Key features of Sentry
- Bug tracking
- Sentry automatically collects errors and exceptions from applications, enabling rapid resolution of issues. Developers can view details of the errors, such as stack traces, the user’s actions prior to the error, and environment variables, which help in analyzing the root cause of the error.
- Performance monitoring
- Sentry provides tools for monitoring application performance, such as transaction durations and server response times. This gives developers detailed insight into how the application behaves in production and helps them identify performance issues before they become critical.
- User experience monitoring
- Sentry provides insights into how end users experience the application. This includes, for example, information on how many users have encountered errors and how these errors affect their user experience. This helps developers prioritize fixes that improve the user experience.
- Alerts and notifications
- Sentry’s alert system ensures that teams are notified of critical errors in real time. Users can customize alert rules based on the severity and frequency of errors, which helps teams respond more quickly to problems.
- Integrations
- Sentry integrates seamlessly with many popular development tools and platforms, such as Slack, GitHub, GitLab, Jira and many more, enabling efficient management of the bug-fixing process and improving workflow automation.
Continuously improve your services using data-driven DevOps and Sentry
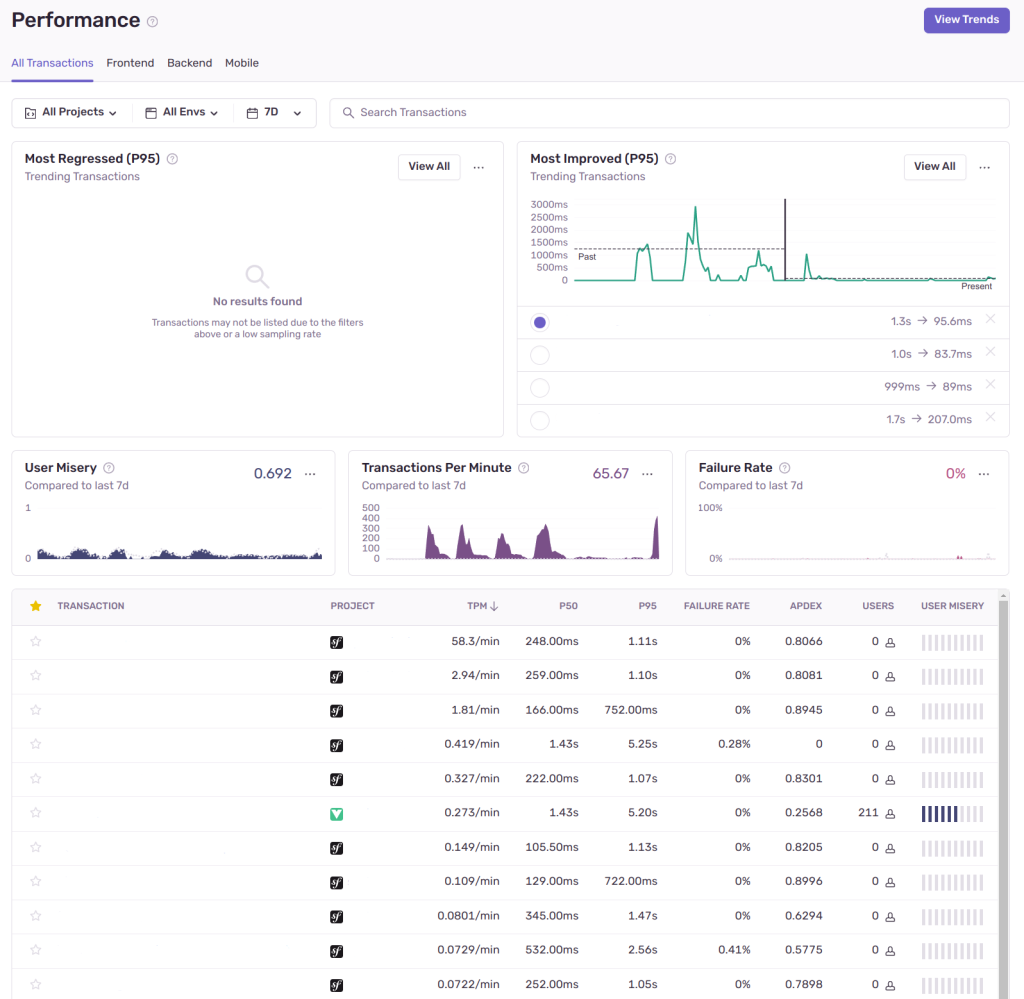
Data-driven decision-making is a key part of DevOps monitoring, which helps companies to continuously improve their services based on the data collected. As a practical example, let’s look at a client’s web application, where we used DevOps monitoring to optimize and improve the user experience and system performance.
Sentry automatically monitors a number of different metrics within the app, such as:
- Transaction duration
- Apdex scores, error rates
- Throughput (TPS)
- Slow Transactions
- Use of resources
In the example web application, Sentry can automatically categorize performance spikes and dips that occur within different transactions. In this case, we were able to optimize the time taken by certain requests to a tenth of the original, which is directly visible to end users as faster response times.
In data-driven decision-making, it is advisable to focus on optimizations that have a significant impact on the application’s performance, such as improving the performance of frequently used functions. For example, database queries that are executed frequently and consume significant resources are a priority for improving efficiency. Optimization can reduce response times and improve the user experience, leading to greater customer satisfaction and, potentially, a larger user base. By analyzing data such as query execution times and their impact on system load, optimization efforts can be targeted at those areas of the software where the impact of changes is greatest.
Proactive monitoring helps to rectify errors before they affect business operations
Sentry’s proactive error monitoring is a process that enables developers to proactively detect and fix errors before they affect end users or the business. This is extremely valuable, as it reduces service disruptions and improves the user experience.
- Real-time monitoring: Sentry collects real-time data on app performance and errors. This includes all app-related exceptions and errors that occur during user interactions or in background processes.
- Detailed error reports: When an error is detected, Sentry collects detailed information, such as stack traces, the user’s actions at the time of the error, environment variables and other relevant data, which help to determine the cause of the error.
- Alerts and notifications: Users can set up alerts for specific types of errors or their frequency of occurrence. When an error exceeds the set thresholds, Sentry sends notifications via email, Slack or another integrated messaging platform, ensuring that the team is informed of the issue immediately.
- Predictive analysis: Sentry also offers a range of tools, such as trend analysis and performance monitoring, which help to predict potential issues based on historical data and current performance metrics.
Improving the software delivery process
Improving the software delivery process with Sentry enables developers to monitor the performance of different application versions and identify discrepancies between versions and potential issues before they affect end users. This ability to monitor version-specific performance is extremely valuable to a development team that is constantly striving to improve and optimize its software products. Below is an example of how Sentry can be used to improve the software delivery process.
- Tracking version-specific performance:
- With Sentry, the team can monitor the performance of different application versions in real time. This includes monitoring errors, delays and other critical metrics.
- Data is collected from each version to provide information on performance, user experience and any potential performance issues.
- Identifying and resolving problems:
- When Sentry detects performance issues or anomalies in a new version, it sends alerts to the development team. The team can view detailed error reports and stack traces so that problems can be identified and fixed quickly.
- The team can also compare the performance of the new version with that of previous versions and identify any regressions or improvements.
- A culture of continuous improvement:
- Using the data provided by Sentry, the development team can make data-driven decisions to improve the application. This may include optimizing performance, improving the user interface or adding new features.
- The team learns from every release, which improves both the development processes and the quality of the end product.
It’s easy to set up a DevOps monitoring tool
The implementation of modern monitoring tools has been made user-friendly and can often be carried out with just a few lines of code. In the case of Sentry, for example, there are ready-made libraries for implementing it on various platforms, such as JavaScript, Python, Java and Ruby, which makes integration smooth and hassle-free. These libraries are designed to integrate seamlessly into developers’ existing projects, offering a wealth of functionality without the need for major changes to the application code.
Once Sentry is integrated, it automatically begins collecting data on the application’s performance and error conditions. Developers can customize the monitoring settings in the Sentry dashboard to best suit their needs, for example by adjusting which types of errors are tracked or at what level data is collected. This enables flexible monitoring that can be tailored to the requirements of each team or project.
In addition, Sentry offers advanced features such as alerts and notifications, which help teams stay up to date with the status of their applications in real time. Users can set up alerts when specific performance thresholds are exceeded or critical errors occur, enabling rapid responses and minimizing potential downtime or performance issues.
Tools such as Sentry make it possible to collect error data without compromising privacy
When measuring and monitoring application performance and error correction in DevOps environments, it is essential to also take into account user privacy and the protection of personal data. Sentry, for example, enables developers to monitor and fix errors in real time, while ensuring that personal data is removed and anonymized.
Tools such as Sentry enable the collection of error data in such a way that all personally identifiable information is either removed or anonymized before the data is stored. This means, for example, that usernames, email addresses, IP addresses and other identifying details are replaced with generic identifiers or removed entirely. This procedure is vital both for protecting users’ privacy and for complying with data protection laws, such as the GDPR.
By using Sentry, DevOps teams can focus on improving the performance and stability of their applications without compromising user privacy. While the tool provides comprehensive information on the application’s status and any potential errors, it also ensures that all data collected is processed with due regard for privacy considerations. This enables developers to respond quickly to issues without compromising data security.
Let’s work together to increase the value of your software
We have now discussed how a monitoring tool compatible with Sentry’s DevOps methodology offers an effective solution for increasing the value and market performance of your software. It enables you to quickly identify and resolve performance issues, minimize security risks and streamline fault tracing. All these features come together in a single, seamlessly integrated package that supports the success of your software projects.
So don’t fail to make the most of your software’s full potential, as advanced monitoring and analytics tools help to support the continuous development of your applications and ensure the best possible user experience.
We’re always on hand to help you choose the technologies and methods best suited to your project, which will help you achieve your business objectives. So, if you’re looking for an expert software development service, don’t hesitate to get in touch with us!
Shall we get started?
"*" indicates required fields